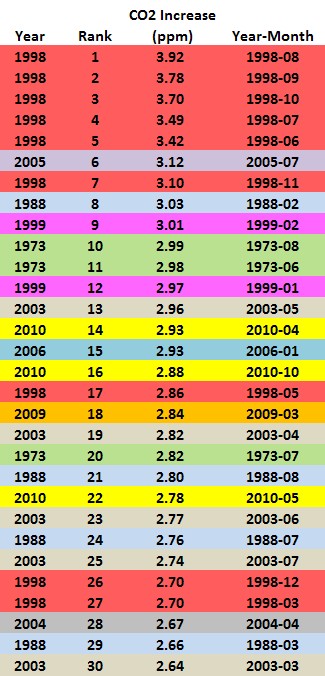
You might be thinking that TheRaven's Mega Melt Enthusiasm is misplaced. Where's the evidence that we face impending acceleration of global temperature increase, melting ice and rising seas? The Top-30 list helps discern some patterns.
Each year in the list is color-coded. This makes it easy to see that 1998 contributed more Top-30 records than any other year. Also, note that the magnitude of CO2 increase in the Top-30 ranges from 2.64ppm up to 3.92ppm. Those increases are +30% to almost 2-times their respective trailing, 5-year averages. Given the concentration of Top-30 jumps in CO-2 over the past dozen years, this is evidence of ongoing trend acceleration.
Said concentration, over the past dozen years, is a bit less obvious. This summary improves clarity.

Top-30 records have been created in only ten years (out of 52). Twenty-three records (3/4th's) have occurred in over just the past dozen years and, thus far, 2010 is the 5th-most productive year on record. While 2010 won't deliver the future-shock awesomeness of 1998, I've got high hopes for 2011. Given population and economic growth that's occurred since 1998, ongoing recovery in the world economy and comparatively greater limitations in Earth's ability to absorb atmospheric carbon, I'm looking at 2011 pretty much as the Cowboys view it. TheRaven and the Cowboys both say....
Wait 'til next year!


+breed+danger+6x8.jpg)


+5x7.jpg)


No comments:
Post a Comment